Learn three levels of swing trading and level up safely - Free 7 day trail here
ZTAI Swing Trading Indicator
ZTAI Swing Trading Indicator is a unified TradingView Pine-Script v6 study that teaches you to spot swing highs and lows across Stocks, Futures, Options & Commodities—without writing a line of code. By blending price-action (EMA, VWAP & daily pivots), momentum (RSI & MACD) and Volume-Smoothed PPO reversals, it highlights three clear swing levels per session so you can build disciplined, level-based analysis with total peace of mind. Please visit the YouTube channel for the video on how this indicator works and how it can help your swing trades and benefit you.
Multi-Factor Signal Construction
Combines EMA/VWAP/pivot filters, RSI & MACD crossovers and Volume/PPO reversal confirmation to minimize noise and surface only the highest-probability levels.


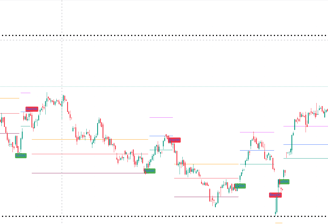
Three Graduated Swing Levels
Plots lines and dynamic labels for Level 1 → Level 2 → Level 3, so you can practice scaling and risk-management milestones in a structured, learning-first way.
Easy to install on TradingView, tweak inputs to match your preferred markets and timeframes. Integrate with alerts or webhooks for chart-driven learning.
Fully Customizable in TradingView Charts


For a 7-day FREE indicator trial, visit the indicator page on TradingView and follow zentraderai

Contact Us
Reach out for 1:1 coaching and enhance your trading experience today!